
PETI: ISR Traps, Solder Debugging, And Lazineering
Last Updated: 2020-09-15 22:30:00 -0500
Over the last two weeks (read: about half a dozen lab hours) I’ve manage to break my stalemate on PETI. For those keeping track, I have been fiendishly attempting to not have to engineer a display driver by instead porting a display driver so badly that I’ve rewritten much of its functionality essentially from scratch.
The need for the port arose in a few different ways:
- The driver I found was for the right display type but for the wrong version of the MSP430 - certainly not my FR5994 at any rate!
- The display I have is a slightly different size, which required some changes in configuration, and;
- In an attempt to minimize the amount of times I need to refer to symbol tables that I can’t actually readily find I am using, at least for now, the driver library TI makes available for the MSP430, which allows for a more API-like interface.
The last time we fought this battle I had encountered a really interesting condition, where I was hitting something that is literally called the ISR Trap, a builtin function that handles the unfortunate situation of the CPU recieving an interrupt flag on a vector for which you have no Interrupt Service Routine created. Troubleshooting this was made much more complicated by two key factors:
- I don’t have a full understanding of the memory map yet and nothing I looked at made sense as an interrupt, and;
- System-level interrupts were being cleared by the device during reset, so by the time the debugger woke up they were gone, and being in debugger mode somehow meant I never encountered the error!
With this I was somewhat stuck, and prior to now I’d probably spent the better part of eight or nine hours banging my head off the desk, looking at any spot in the registers that made any kind of sense at all, and referencing manuals, text books, and talk slides trying to find anything useful. Then one day in the shower it hit me: if I can’t hit the right interrupt from within the debugger, I need a way to get debugging output in regular operation!
print(“Made it to 487”)
I have a confession to make - I am in no way shape or form a professional developer. I’m self taught, full of code smells and bad habits. Before I learned the proper use of IDEs in my python (and before that, Lua) work, I would frequently debug by making a print statement - an uncomplicated print stashed somewhere in a function to give me a visual indicator that the program or script made it to a certain point before it failed.
(Amusingly, this both duplicates functions already in the python interpreter as well as being the origin of the debugPrint function in Tapestry).
The problem is, while this might be a useful solution in future versions of PETI, I can’t very well issue print statements to a display I can’t yet control properly, at least not reliably. What I needed was some other kind of display. Something I knew how to interact with from experience.
Building the Tool
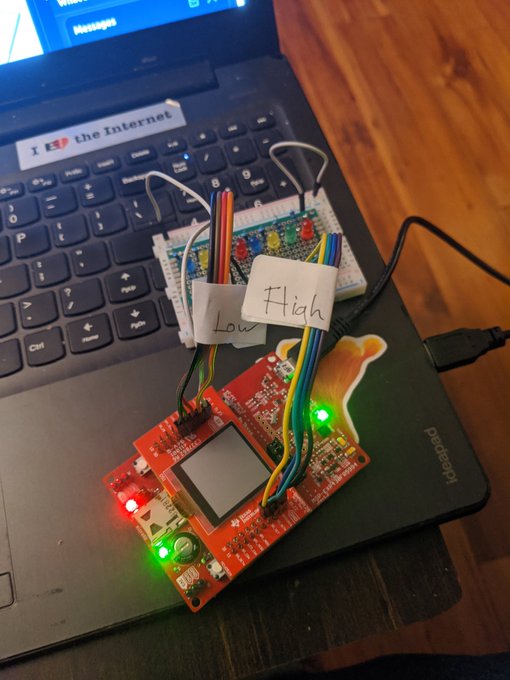
My first and only finished MSP430 product was a really trivial little binary counter that simply worked by incrementing an integer stored in a memory address and then dropping that whole byte into an output register. This would cause the GPIO pins controlled by that register to toggle on and off in a very readable way, if you can read binary. I never committed that hardware to anything permanent though, but it occurred to me the basic operating principle could be the same - if I can dedicate a byte’s worth of GPIO pins, I can trivially raise eight different output flags without ever touching the LCD, and less-trivially output an actual error code that would cover up to 255 error conditions.
Since it didn’t seem likely to me that this would be the last time I would need that kind of output, I decided to break into a box of perfboard I have and actually solder this up. It wasn’t the best design - I’m already thinking of a version two, but this is the first physical tool I’ve made for myself that was more complicated than a solid jig of some description.
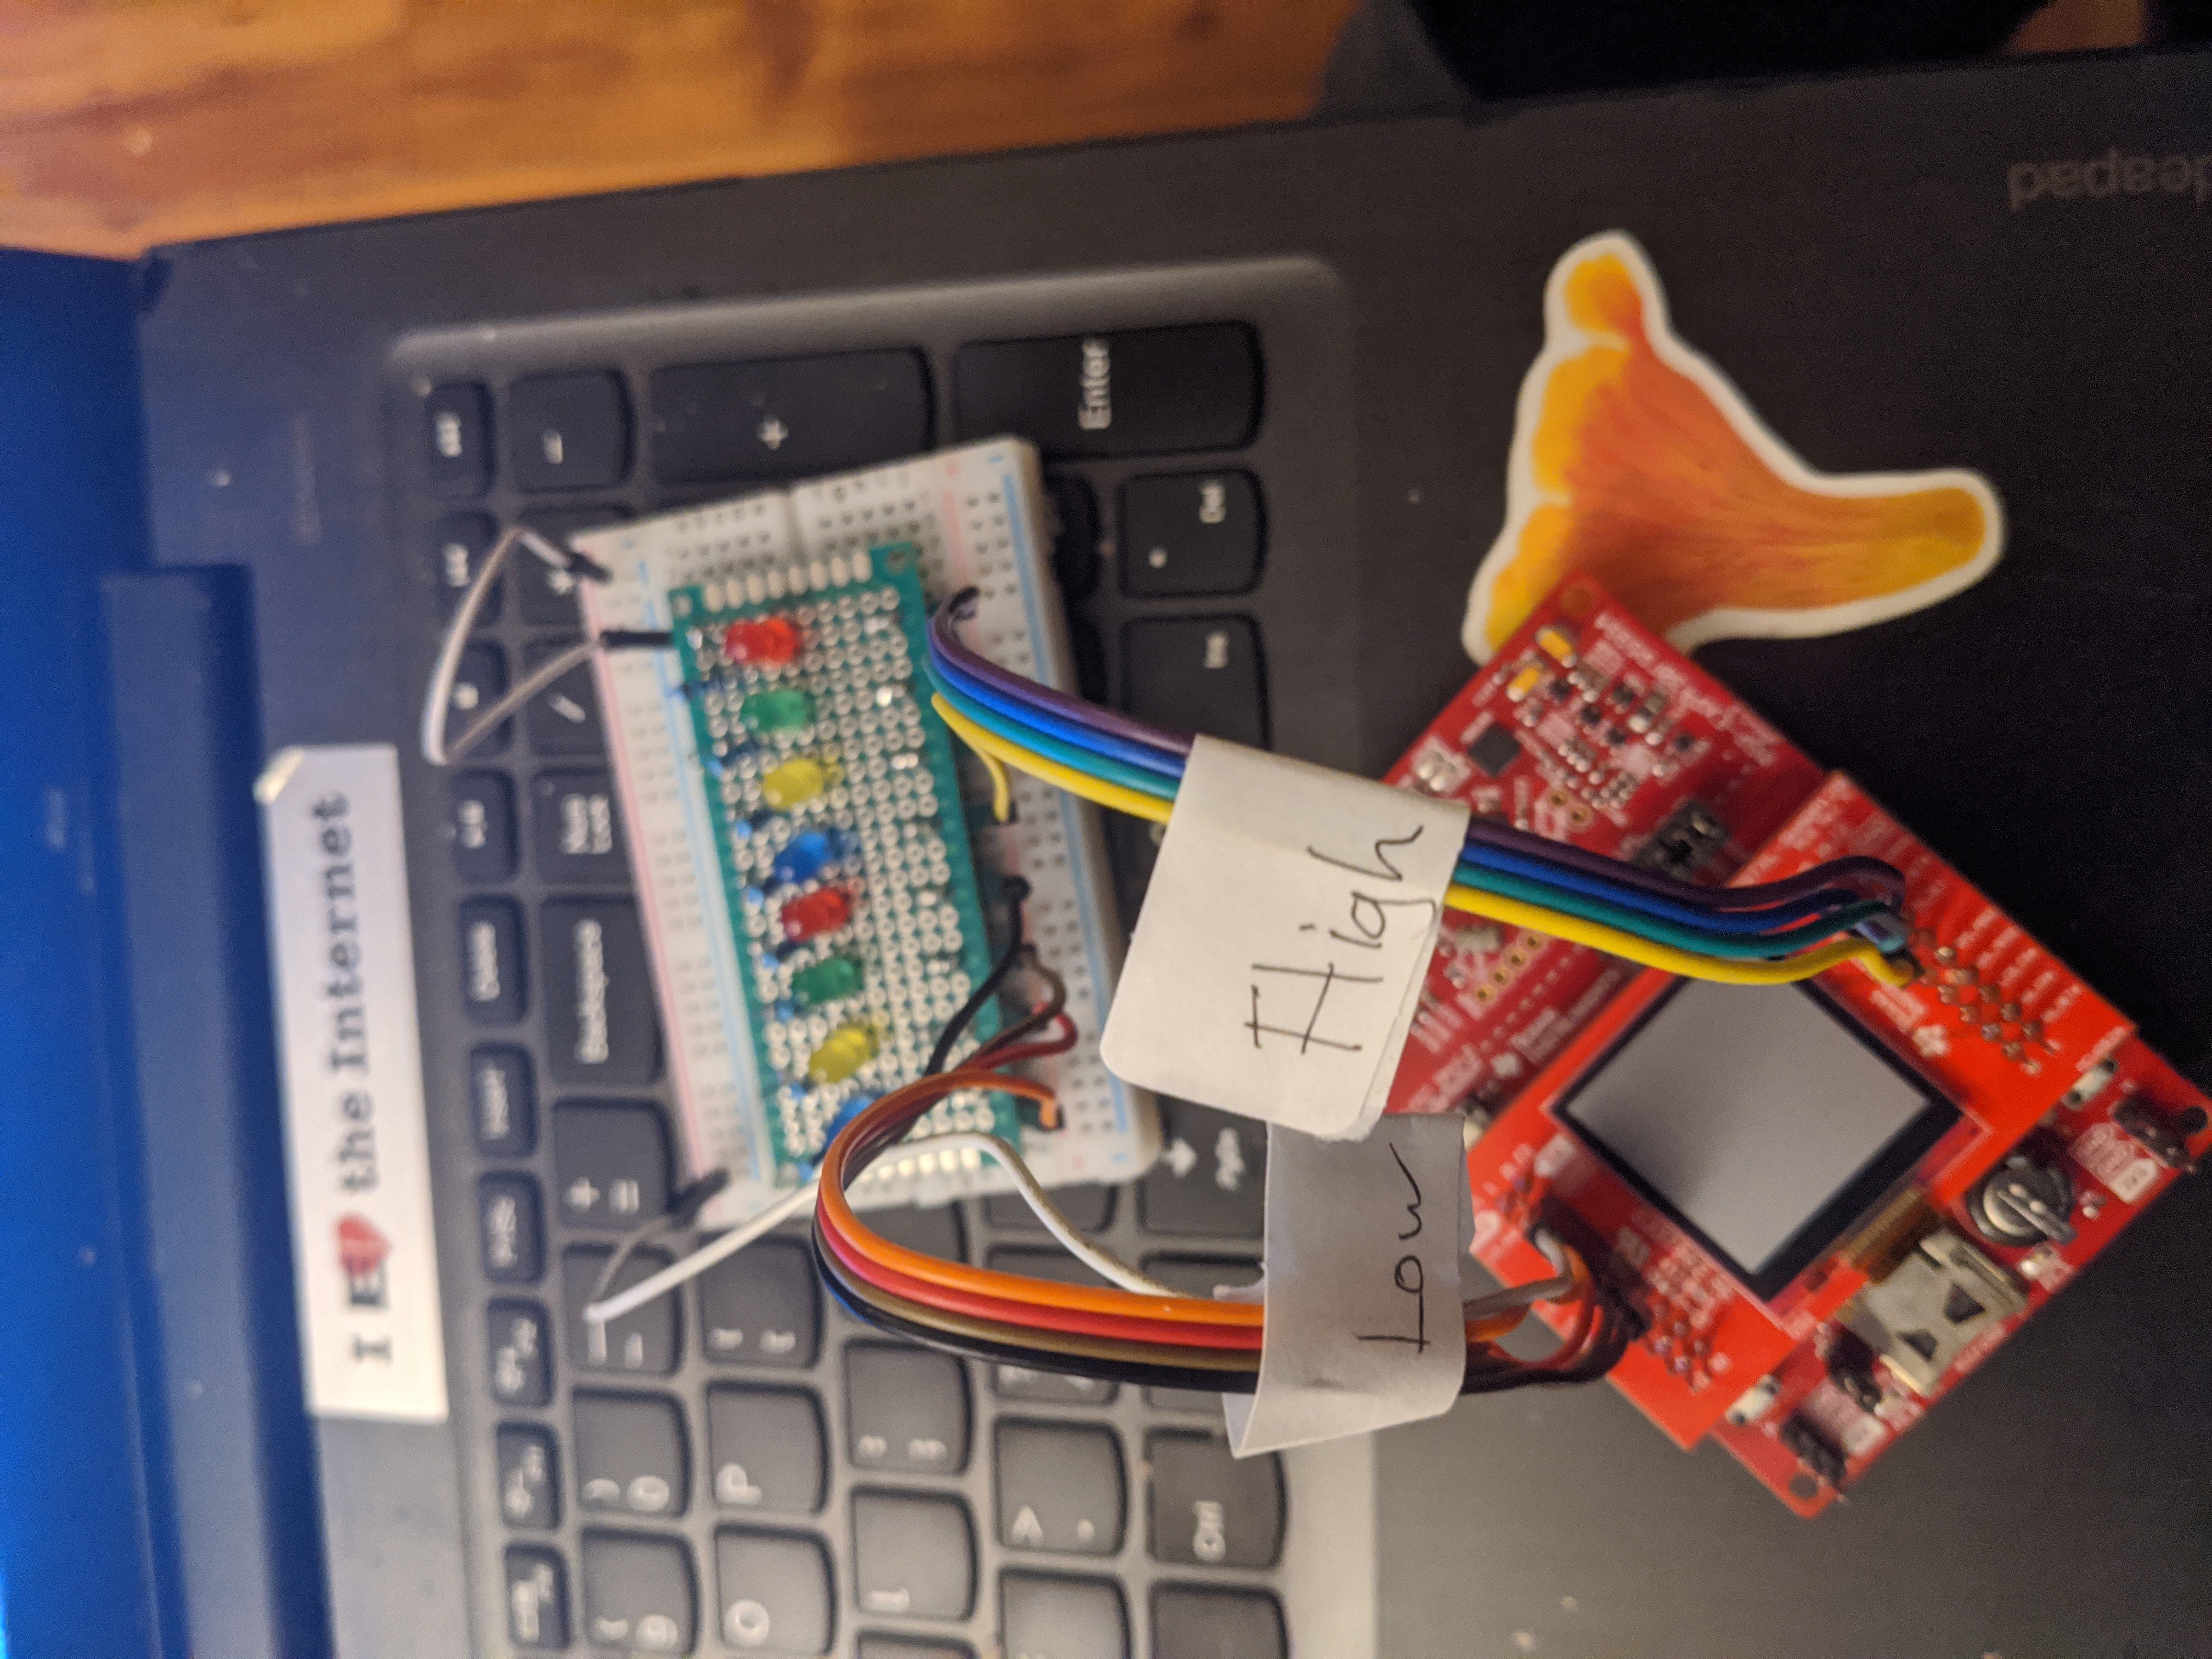
It’s all very simple, just eight LEDs with their own positive terminals and connected on the negative end to 100 Ohm resistors, all with a shared return terminal. The whole unit fits nicely onto a small breadboard, though this is a little crowded. If I find myself using it a lot I might make a more compact version.
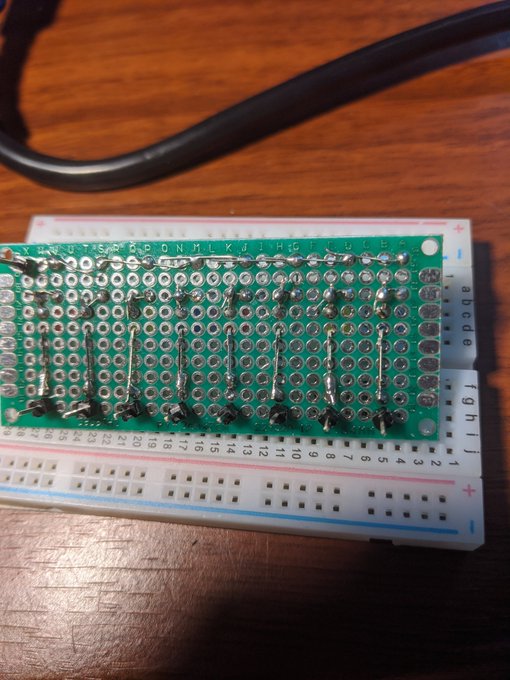
The “traces” are chiefly just the leads on the passive components and solder, though there’s a couple of pure-solder bridges, a technique I’d like to get better at. This was only my third outing with this particular iron, and I’m finding it has quite the curve.
Chasing the Phantom ISR
So, at this point, two or three hours of work doing the soldering behind us, I was pretty sure I didn’t have a system-level interrupt because I had convinced myself this was the case. I was convinced, firmly convinced, that the unhandled ISRs had to be in the user space. Since they were taking priority over Timer A0’s interrupt, I knew there was a finite number of things it could be:
- Timer B0 also has an interrupt that takes the highest priority of all the user interrupts.
- eUSCI B is enabled - that’s how I do SPI - and it has an interrupt condition for transmitting and another for recieving.
- The 12-bit Analog/Digital Converter can raise an interrupt, though I’m not using it.
All other interrupts that were in userland /and/ outranked Timer A0, such as the Watchdog Timer, I had already explicitly disabled, and not even with the API - I went ahead and set the appropriate bits in memory using the predefined callouts.
This is well less then eight possible failure modes, so I went ahead, created some new ISRs slowly over the course of a couple more hours, double-checked them against the appropriate .h file. Great, recompile, plug everything in, send it to the device, and…
Nothing.
After a few minutes of ranting and raving, I realize that the flaw wasn’t in my method but my hypothesis: somehow, I’m hitting a system-level interrupt. Those are cleared on reboot and since I can’t hit this ISR trap in quite the same way from Debug mode, I’m never going to know what it is - worse, there’s two bytes that control the SIs, so I can’t just dump the value into the debugger.
It took all of ten seconds at that point for me to comment out one particular function, rerun, and validate that I don’t hit the ISR Trap. Ten minutes after that, I’d realized that that function contains a child function, called nowhere else, which is the actual culprit. Without the child, everything runs fine.
Amusingly, this function is the one and only function that I had left that I haven’t heavily modified after the original port. Most of the functions in my display proof of concept are essentially scratch-written, with only a passing resemblance to the original code example, which it’s occuring to me I don’t even know actually worked.
Obviously, what happens over the next week or two is going to be me rewriting that function, if necessary the parent it underpins, and getting printText() working on my display.
How Did We Get Here?
Well, that’s right in the title. Lazineering. My job title sure says Engineer, but I’m not sure my qualifications actually stretch that far, and while I’m relatively analytical I have more in common with a jazz musician or abstract painter than a proper engineer. I cobble together the knowledge I have in the best way I know how.
Since I didn’t know a thing about writing display drivers and nearly that little about the MSP430FR5994 memory architecture and peripheral structure I wanted to do as little as possible to get a working prototype. And while I’m certianly further ahead than I likely would be if I was flying completely in the dark, the fact of the matter is I’ve now scratch-rewritten so much code that I feel I pretty much understand the eUSCI_B peripheral’s SPI operation modes and enough about the SHARP memory LCD I’m using and how it wants to speak to the controller that I could, if I lost all my files, probably rebuild a working display driver.
The key failure I had was trusting the original code. I’ve found at least three places in the code so far where I’m positive invalid instructions would be passed to the LCD regardless of differences between its original version of the microcontroller and mine. I really shouldn’t have been surprised this function was causing my problems, and in fact it should have been the first place I checked.
Brr! It’s getting cold out there already, and its only September. If for some reason you enjoy Tapestry, PETI, or any of the other projects I’m working on for Kensho Security Labs, and you wanted to show your support financially, your best avenue is via my Github Sponsors account. If you’re feeling the need, I also enjoy coffee. Today’s media recommendation: HBO’s Chernobyl series, from 2019. It’s very good, I promise, and that’s not paid promotion - I just liked it.